In our effort to be as transparent as possible, and in response to requests from our community, we have made the following dashboards easily available for public view. We believe this action reflects our continued effort to achieve our values of innovation, integrity, service, stewardship and teamwork. These interactive dashboards show data related to incidents and calls for service, allowing the community to be more informed. We will continue to work with our community to provide a safe and empowered learning environment. We invite UT community members to view the following information.
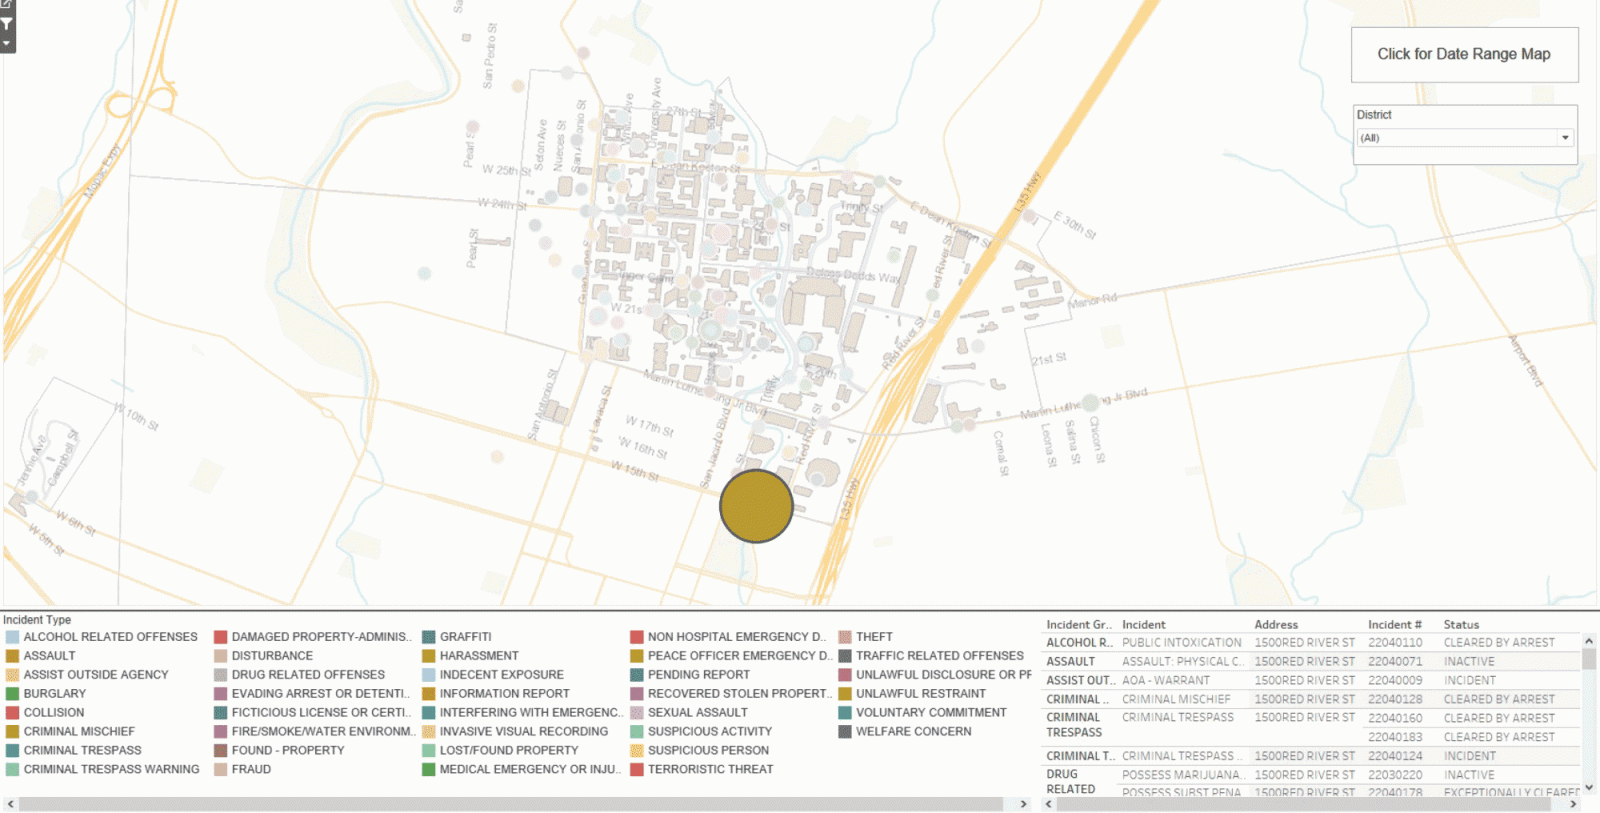
UTPD's priority is the safety of our community. Our officers often respond to calls initiated by hospital staff at Dell Seton Medical Center (1500 Red River St.), a Level 1 Trauma Center that provides medical care to 11 surrounding counties. These calls regularly include: Police Officer Emergency Detention (POED), Criminal Trespass, Assault, and assisting outside law enforcement agencies.
Areas west of campus are in Austin Police Department's jurisdiction, however, UTPD officers often respond to support APD during incidents. When UTPD responds, data for those calls are captured in this dashboard, but does not capture the totality of all incidents that have occurred in that area.
All media inquiries should be directed to utpd-pio@austin.utexas.edu
Please direct any feedback to utpd.feedback@austin.utexas.edu
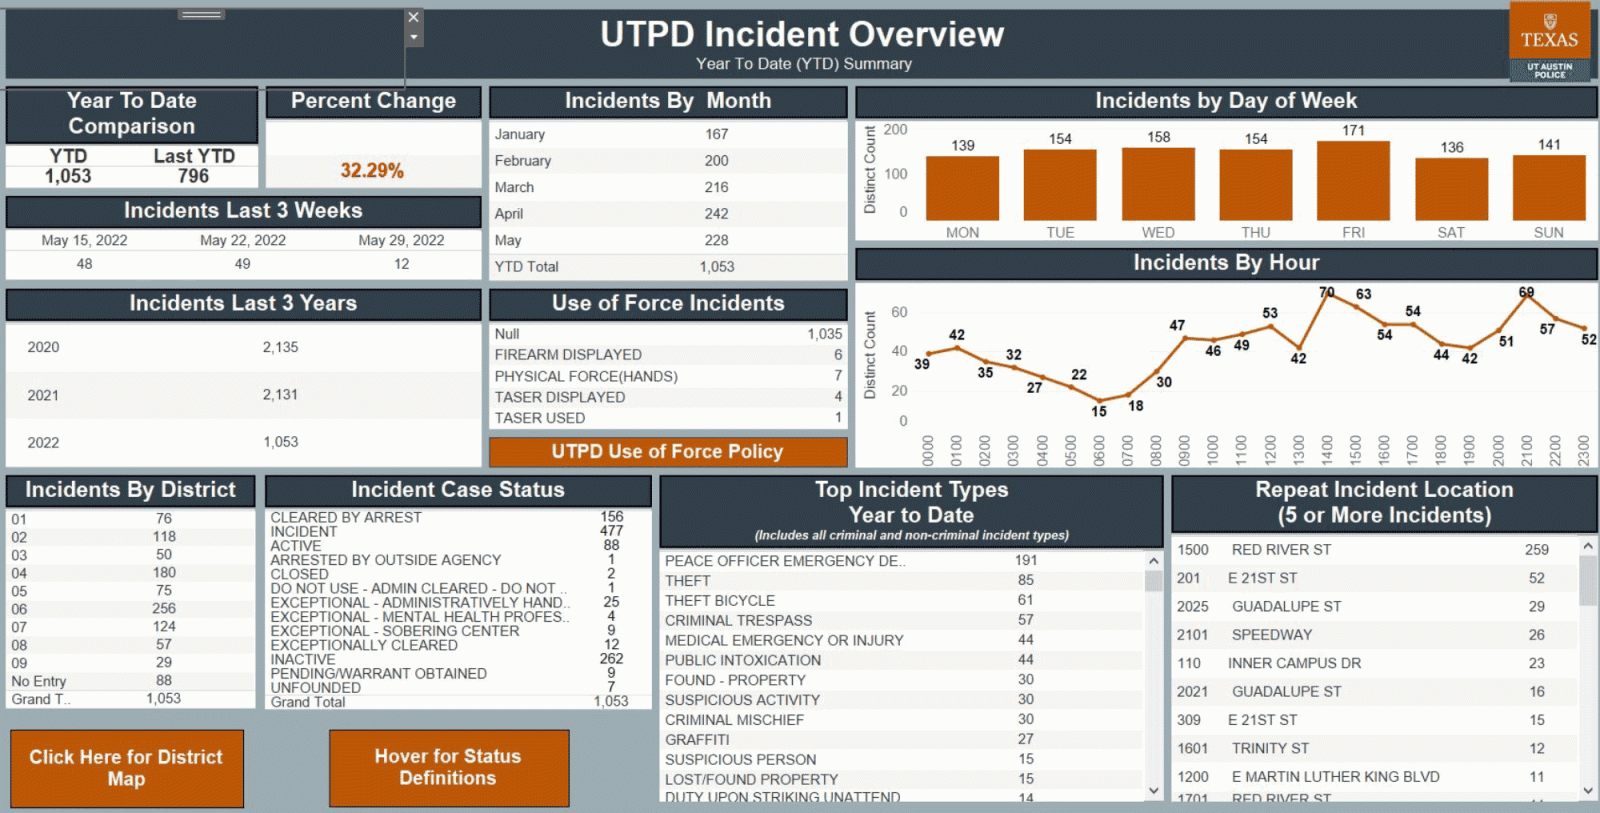
UTPD Incident Overview
Each table within the dashboard is interactive and clickable. The date parameter is set and unable to be manipulated as this dashboard was created to provide data comparison tables over hours, days, weeks, months, and years.
An "Incident" is any occurrence requiring an officer to respond – Not all incidents are criminal offenses. Click here to see UTPD’s Use of Force Policy in full.
Click here to view UTPD Incident Overview table

Maps
There are two map views: Default Map and Date Range Map. The Default Map has a set parameter of the last thirty days. The Date Range Map allows for the date to be changed using the Date Reported slider in the top right of the map. To toggle between the map views, use the "Click for Date Range Map" or "Click for Default Map" button in the top right hand corner of each map.
Each dot on the map indicates an incident or a group of incidents at the same address. Note these incidents may not be related. Click the dot to see the incident information in the panel to the lower right of the map. The panel does not appear until a dot is clicked. The panel will show all incidents at that address for the date parameters of the map and provides the Incident Group, Incident, Address, Incident Number (#), and (Case) Status. The Incident Number corresponds to the report written by the responding officer(s) and can be used to request a copy of the official police report. There are hover tooltips for the Districts on the maps. If the cursor is hovered over an area, a tooltip will pop up to advise of the corresponding District number. If the area is clicked, the entire District will be highlighted in a color to indicate the whole of the District. To remove the highlight effect in any selection, just click it again or click elsewhere on the map.
Default Map
Default Map - The view on the map can be changed by using the District drop down in the right corner of the map or by clicking on a dot within the map. The view can also be manipulated using the map tools in the upper left corner of the map to zoom in or out, magnify an area, toggle in other directions, etc.
Click here for the University’s Default Map

Calls for Service
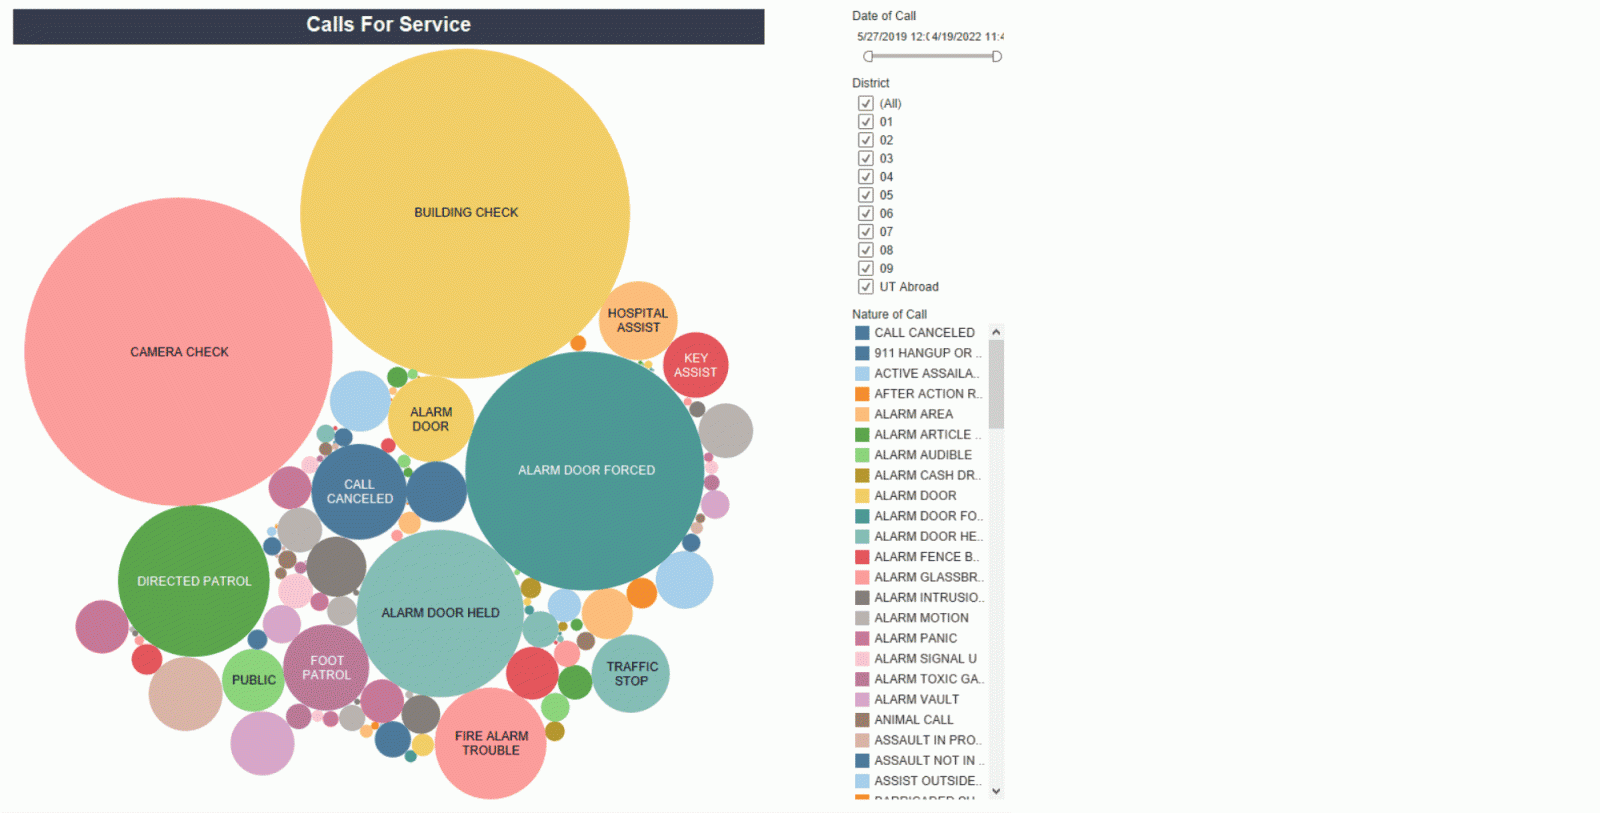
A "Call for Service" is any call received by UTPD. Not all Calls for Service (CFS) lead to an incident report, but all incident reports start as a Call for Service. The view on the dashboard can be changed by using the Date of Call slider, District boxes, and/or clicking on a specific Nature of Call type in the filter column to the right of the infographic.
Each bubble on the infographic represents a CFS Nature Code (Nature of Call) which is related to how the caller characterized the situation being reported. These are similar to Incident titles. The bigger the bubble, the larger the number of that nature of call. Hover over the bubble to see the Nature of Call and the Number indicating how many calls UTPD received for that Nature of Call for the parameters set. Not Assigned represents incidents involving UT affiliated persons (students, staff, faculty, etc) that occur elsewhere on a global map.
Click here to view Calls for Service Map

